
Mapped: Which U.S. area codes are running out of numbers?
Orange County, California, and southeast Georgia are now first in line to run out of new phone numbers.
The North American Numbering Plan Administrator (NANPA) projects that California’s 657/714 area codes, which serve most of northern Orange County, and Georgia’s 912, which serves Savannah and much of southeast Georgia, will use up their unassigned prefixes in Q2 2028. Georgia regulators have approved a 565 overlay for the 912 region, and an overlay for 657/714 is pending approval from the California Public Utilities Commission.
A prefix, also called a central office code, is the three-digit exchange that follows the area code, like the 555 in 212-555-1234. Each prefix holds up to 10,000 phone numbers, and every area code has a limited supply of them. NANPA tracks that supply and forecasts when each numbering plan area (NPA, the industry term for an area code) may exhaust its available central office codes.
New York City had been first in line to run out, but the 465 overlay that went into service in June pushed its projected exhaust date back to Q2 2041. That leaves California and Georgia at the front of the line in Q2 2028, with six more area codes projected to run out of numbers by the end of 2029.
Key takeaways
- California’s 657/714 and Georgia’s 912 are now projected to run out of new phone numbers first, in Q2 2028. Existing numbers will be unaffected.
- Six more area codes are projected to run out of numbers in 2029 and two more in 2030.
- These projected dates aren’t fixed. In NANPA’s October 2026 update, New York City’s 347/718/917/929 exhaust date moved from Q3 2027 to Q2 2041 after the new 465 overlay was added.
- When an area code runs low on new numbers, an overlay code can be added to serve the same region.
- NANPA counted 375 geographic area codes serving the U.S. and its territories as of the end of 2025, up from 239 in 2000.
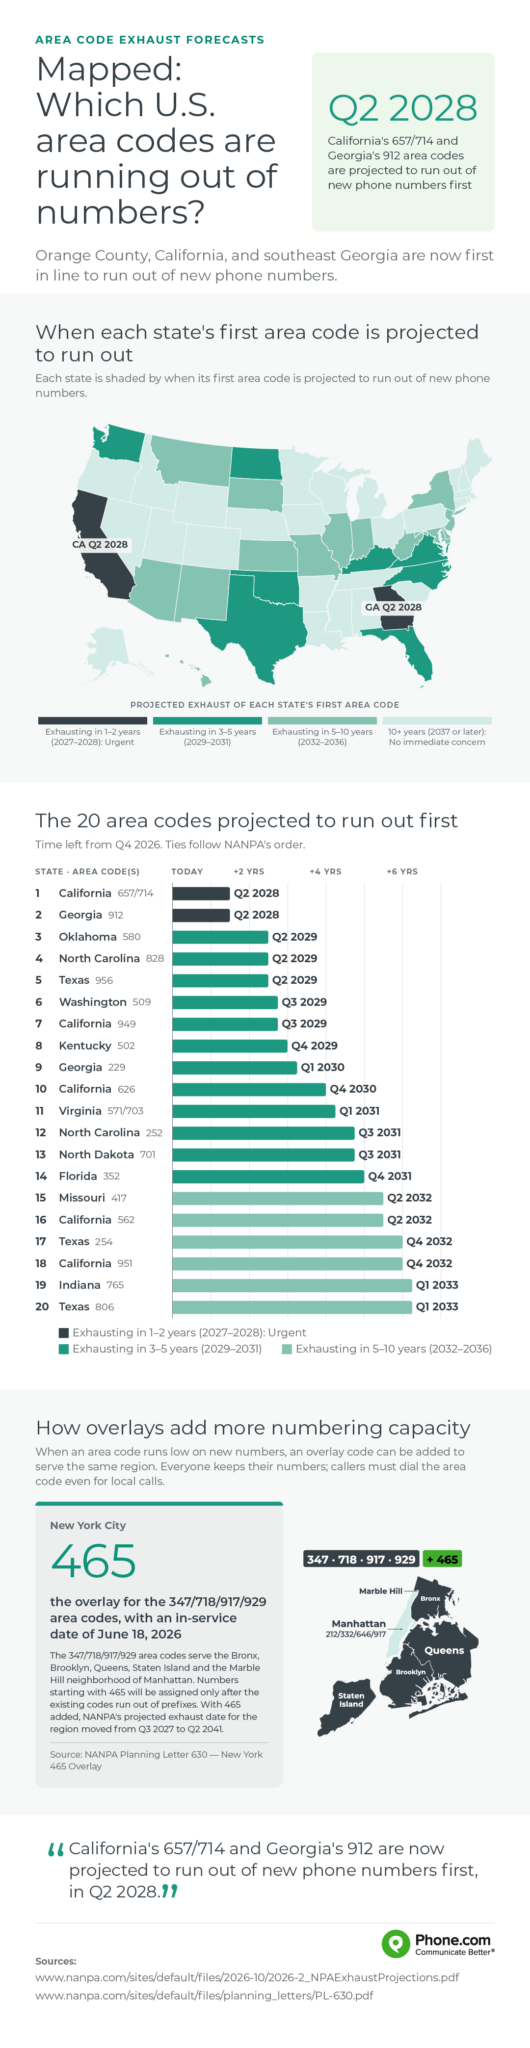
Which U.S. area codes are projected to run out of new numbers first?
California’s 657/714 area and Georgia’s 912 are projected to exhaust their available numbers first, both in Q2 2028. Six more area codes follow in 2029, and the last two entries in the top 10 fall in 2030.
|
State |
Area code(s) |
Projected exhaust date |
|
California |
657/714 |
Q2 2028 |
|
Georgia |
912 |
Q2 2028 |
|
Oklahoma |
580 |
Q2 2029 |
|
North Carolina |
828 |
Q2 2029 |
|
Texas |
956 |
Q2 2029 |
|
Washington |
509 |
Q3 2029 |
|
California |
949 |
Q3 2029 |
|
Kentucky |
502 |
Q4 2029 |
|
Georgia |
229 |
Q1 2030 |
|
California |
626 |
Q4 2030 |
What does area code exhaustion mean?
Area code exhaustion means an area code has no unassigned prefixes left to give out.
Phone numbers that people already have keep working. What changes is where new lines get their numbers: Once the supply runs out, the region needs another area code to support future assignments.
NANPA forecasts exhaustion by tracking the supply of prefixes in each area code, not the unused phone numbers individual providers may still hold.
Why can an exhaust forecast change?
NANPA builds each forecast based on how many prefixes carriers are using and how many they expect to need, so when demand speeds up or slows down, the projected exhaust date changes.
NANPA publishes new projections every April and October and can revise them in between when new data changes the picture. For instance, in February 2026, NANPA pushed California’s 657/714 exhaust date back from Q4 2027 to Q2 2028, citing a decrease in prefix assignments. Its July 6 revisions did the same for four Texas forecasts, pushing the dates back by anywhere from nine months to 10 years.
What happens when an area code needs more numbers?
When an area code is close to running out of numbers, state regulators can choose to either split the geographic area, allowing one part to keep its area code and reassigning a new one to the rest, or use an overlay, which adds another code to serve an area alongside its existing code.
Splits used to be common, but overlays are now the industry’s preferred option. The reason is simple: A two-way split forces roughly half of the customers in that area to change area codes, according to the California Public Utilities Commission, while an overlay lets everyone keep their numbers. The trade-off is that callers in an overlay region must dial the area code even for local calls, an FCC requirement.
New York City shows how it plays out. For the 347/718/917/929 region, regulators set June 18, 2026, as the in-service date for the 465 overlay, more than a year before the region’s then-projected exhaust date. Anyone with an existing number keeps it. Numbers starting with 465 will be assigned only after the existing codes run out of prefixes. With 465 added to the pool, NANPA’s October 2026 forecast pushed the region’s projected exhaust date from Q3 2027 to Q2 2041.
New York is part of a much bigger pattern. NANPA counted 239 geographic NPAs serving the U.S. and its territories in 2000 and 375 in 2025, an increase of 136 over 25 years. NANPA attributes the demand for new numbers to three factors: new technologies, customers with more phone lines and a growing number of service providers that each need their own numbers.
What does area code exhaustion mean for businesses?
Area code exhaustion doesn’t affect a business’s existing phone numbers, but it can limit which area codes are available for new lines.
Once an area code runs out of prefixes, new lines may come from the overlay code instead, so a business with a 718 number that adds a line could end up with a 465 number. Customers in an overlay region also have to dial all 10 digits, so any system that assumes seven-digit dialing is worth checking.
It matters most for companies that treat a local area code as part of their identity. As new capacity moves to an overlay, getting a number under an older area code may become harder. Providers such as Phone.com let businesses search for local numbers by area code, including numbers outside their physical location, so a company entering a new market can check what’s available rather than assume a particular area code will stay open.
Will we ever run out of phone numbers?
According to NANPA, we shouldn’t run out of numbers for several decades.
Its October 2026 NANP Exhaust Analysis projects that the North American Numbering Plan, which covers the U.S., Canada and parts of the Caribbean, will use up its available area codes in 2064. If demand for prefixes falls about 6%, that moves to 2067. Individual area codes can run out of prefixes much sooner, which is why NANPA forecasts each one separately.
When is your area code projected to be exhausted?
Outside the top 10, every area code on NANPA’s list is projected to run out in 2031 or later. Here are NANPA’s projected exhaust dates for U.S. area codes, organized by state and code(s):
|
State |
Area code(s) |
Projected exhaust year |
|
Alabama |
251 |
2043 |
|
Alabama |
205/659 |
2073 |
|
Alabama |
256/938 |
2042 |
|
Alabama |
334/483 |
2065 |
|
Alaska |
907 |
2056 |
|
Arizona |
520 |
2033 |
|
Arizona |
928 |
2037 |
|
Arizona |
480/602/623 |
2058 |
|
Arkansas |
479 |
2037 |
|
Arkansas |
501 |
2042 |
|
Arkansas |
327/870 |
2062 |
|
California |
562 |
2032 |
|
California |
626 |
2030 |
|
California |
650 |
2038 |
|
California |
661 |
2033 |
|
California |
831 |
2080 |
|
California |
925 |
2047 |
|
California |
949 |
2029 |
|
California |
951 |
2032 |
|
California |
209/350 |
2061 |
|
California |
213/323/738 |
2046 |
|
California |
279/916 |
2068 |
|
California |
310/424 |
2044 |
|
California |
341/510 |
2085 |
|
California |
357/559 |
2074 |
|
California |
369/707 |
2075 |
|
California |
408/669 |
2063 |
|
California |
415/628 |
2087 |
|
California |
442/760 |
2046 |
|
California |
530/837 |
2099 |
|
California |
619/858 |
2041 |
|
California |
657/714 |
2028 |
|
California |
747/818 |
2064 |
|
California |
805/820 |
2082 |
|
California |
840/909 |
2061 |
|
Colorado |
719 |
2037 |
|
Colorado |
303/720/983 |
2070 |
|
Colorado |
748/970 |
2101 |
|
Connecticut |
203/475 |
2061 |
|
Connecticut |
860/959 |
2090 |
|
Delaware |
302 |
2035 |
|
District of Columbia |
202/771 |
2100 |
|
Florida |
239 |
2040 |
|
Florida |
321 |
2046 |
|
Florida |
352 |
2031 |
|
Florida |
386 |
2049 |
|
Florida |
727 |
2044 |
|
Florida |
772 |
2110 |
|
Florida |
863 |
2053 |
|
Florida |
941 |
2045 |
|
Florida |
305/645/786 |
2050 |
|
Florida |
321/407/689 |
2046 |
|
Florida |
324/904 |
2061 |
|
Florida |
448/850 |
2061 |
|
Florida |
561/728 |
2055 |
|
Florida |
656/813 |
2060 |
|
Florida |
754/954 |
2071 |
|
Georgia |
229 |
2030 |
|
Georgia |
478 |
2048 |
|
Georgia |
912 |
2028 |
|
Georgia |
404/470/678/943 |
2041 |
|
Georgia |
470/678/770/943 |
2041 |
|
Georgia |
706/762 |
2041 |
|
Hawaii |
808 |
2033 |
|
Idaho |
208/986 |
2066 |
|
Illinois |
217/447 |
2051 |
|
Illinois |
224/847 |
2034 |
|
Illinois |
309/861 |
2112 |
|
Illinois |
312/872 |
2048 |
|
Illinois |
331/630 |
2087 |
|
Illinois |
464/708 |
2056 |
|
Illinois |
618/730 |
2043 |
|
Illinois |
773/872 |
2051 |
|
Illinois |
779/815 |
2045 |
|
Indiana |
219 |
2049 |
|
Indiana |
260 |
2072 |
|
Indiana |
574 |
2104 |
|
Indiana |
765 |
2033 |
|
Indiana |
317/463 |
2061 |
|
Indiana |
812/930 |
2079 |
|
Iowa |
319 |
2055 |
|
Iowa |
515 |
2046 |
|
Iowa |
563 |
2083 |
|
Iowa |
641 |
2039 |
|
Iowa |
712 |
2040 |
|
Kansas |
316 |
2063 |
|
Kansas |
620 |
2035 |
|
Kansas |
785 |
2033 |
|
Kansas |
913 |
2063 |
|
Kentucky |
502 |
2029 |
|
Kentucky |
606 |
2036 |
|
Kentucky |
859 |
2062 |
|
Kentucky |
270/364 |
2116 |
|
Louisiana |
225 |
2062 |
|
Louisiana |
337 |
2056 |
|
Louisiana |
504 |
2063 |
|
Louisiana |
985 |
2111 |
|
Louisiana |
318/457 |
2095 |
|
Maine |
207 |
2051 |
|
Maryland |
227/240/301 |
2043 |
|
Maryland |
410/443/667 |
2036 |
|
Massachusetts |
413 |
2049 |
|
Massachusetts |
339/781 |
2126 or later |
|
Massachusetts |
351/978 |
2126 or later |
|
Massachusetts |
508/774 |
2047 |
|
Massachusetts |
617/857 |
2072 |
|
Michigan |
231 |
2085 |
|
Michigan |
269 |
2055 |
|
Michigan |
517 |
2054 |
|
Michigan |
586 |
2092 |
|
Michigan |
616 |
2071 |
|
Michigan |
734 |
2048 |
|
Michigan |
810 |
2059 |
|
Michigan |
906 |
2111 |
|
Michigan |
989 |
2039 |
|
Michigan |
248/947 |
2074 |
|
Michigan |
313/679 |
2086 |
|
Minnesota |
218 |
2038 |
|
Minnesota |
320 |
2076 |
|
Minnesota |
612 |
2055 |
|
Minnesota |
651 |
2102 |
|
Minnesota |
763 |
2123 |
|
Minnesota |
952 |
2126 or later |
|
Minnesota |
507/924 |
2126 or later |
|
Mississippi |
228 |
2108 |
|
Mississippi |
471/662 |
2126 or later |
|
Mississippi |
601/769 |
2054 |
|
Missouri |
417 |
2032 |
|
Missouri |
636 |
2076 |
|
Missouri |
660 |
2102 |
|
Missouri |
235/573 |
2065 |
|
Missouri |
314/557 |
2060 |
|
Missouri |
816/975 |
2069 |
|
Montana |
406 |
2034 |
|
Nebraska |
308 |
2064 |
|
Nebraska |
402/531 |
2043 |
|
Nevada |
775 |
2051 |
|
Nevada |
702/725 |
2064 |
|
New Hampshire |
603 |
2052 |
|
New Jersey |
856 |
2035 |
|
New Jersey |
908 |
2036 |
|
New Jersey |
201/551 |
2053 |
|
New Jersey |
609/640 |
2051 |
|
New Jersey |
732/848 |
2052 |
|
New Jersey |
862/973 |
2047 |
|
New Mexico |
505 |
2033 |
|
New Mexico |
575 |
2059 |
|
New York |
585 |
2037 |
|
New York |
607 |
2053 |
|
New York |
914 |
2034 |
|
New York |
212/332/646/917 |
2057 |
|
New York |
315/680 |
2061 |
|
New York |
329/845 |
2060 |
|
New York |
347/465/718/917/929 |
2041 |
|
New York |
363/516 |
2073 |
|
New York |
518/838 |
2061 |
|
New York |
624/716 |
2115 |
|
New York |
631/934 |
2080 |
|
North Carolina |
252 |
2031 |
|
North Carolina |
828 |
2029 |
|
North Carolina |
336/743 |
2077 |
|
North Carolina |
472/910 |
2051 |
|
North Carolina |
704/980 |
2040 |
|
North Carolina |
919/984 |
2048 |
|
North Dakota |
701 |
2031 |
|
Ohio |
216 |
2047 |
|
Ohio |
220/740 |
2064 |
|
Ohio |
234/330 |
2044 |
|
Ohio |
283/513 |
2084 |
|
Ohio |
326/937 |
2090 |
|
Ohio |
380/614 |
2070 |
|
Ohio |
419/567 |
2044 |
|
Ohio |
436/440 |
2126 or later |
|
Oklahoma |
580 |
2029 |
|
Oklahoma |
405/572 |
2060 |
|
Oklahoma |
539/918 |
2052 |
|
Oregon |
458/541 |
2053 |
|
Oregon |
503/971 |
2041 |
|
Pennsylvania |
215/267/445 |
2054 |
|
Pennsylvania |
223/717 |
2055 |
|
Pennsylvania |
272/570 |
2038 |
|
Pennsylvania |
412/878 |
2039 |
|
Pennsylvania |
484/610/835 |
2050 |
|
Pennsylvania |
582/814 |
2059 |
|
Pennsylvania |
724/878 |
2079 |
|
Puerto Rico |
787/939 |
2064 |
|
Rhode Island |
401 |
2051 |
|
South Carolina |
803/839 |
2046 |
|
South Carolina |
821/864 |
2055 |
|
South Carolina |
843/854 |
2055 |
|
South Dakota |
605 |
2034 |
|
Tennessee |
731 |
2111 |
|
Tennessee |
865 |
2051 |
|
Tennessee |
901 |
2041 |
|
Tennessee |
931 |
2052 |
|
Tennessee |
423/729 |
2090 |
|
Tennessee |
615/629 |
2063 |
|
Texas |
254 |
2032 |
|
Texas |
325 |
2055 |
|
Texas |
361 |
2051 |
|
Texas |
409 |
2054 |
|
Texas |
432 |
2088 |
|
Texas |
806 |
2033 |
|
Texas |
830 |
2089 |
|
Texas |
915 |
2081 |
|
Texas |
936 |
2077 |
|
Texas |
940 |
2051 |
|
Texas |
956 |
2029 |
|
Texas |
979 |
2075 |
|
Texas |
210/726 |
2072 |
|
Texas |
214/469/945/972 |
2036 |
|
Texas |
281/346/621/713/832 |
2041 |
|
Texas |
430/903 |
2050 |
|
Texas |
512/737 |
2045 |
|
Texas |
682/817 |
2039 |
|
Utah |
435 |
2080 |
|
Utah |
385/801 |
2037 |
|
Vermont |
802 |
2064 |
|
Virginia |
276 |
2072 |
|
Virginia |
434 |
2042 |
|
Virginia |
540/826 |
2053 |
|
Virginia |
571/703 |
2031 |
|
Virginia |
686/804 |
2060 |
|
Virginia |
757/948 |
2058 |
|
Washington |
253 |
2058 |
|
Washington |
425 |
2046 |
|
Washington |
509 |
2029 |
|
Washington |
206/564 |
2081 |
|
Washington |
360/564 |
2069 |
|
West Virginia |
304/681 |
2034 |
|
Wisconsin |
262 |
2037 |
|
Wisconsin |
414 |
2042 |
|
Wisconsin |
274/920 |
2065 |
|
Wisconsin |
353/608 |
2075 |
|
Wisconsin |
534/715 |
2071 |
|
Wyoming |
307 |
2056 |
Methodology
This analysis uses NANPA’s October 2026 NPA Exhaust Analysis, based on Numbering Resource Utilization/Forecast (NRUF) and central office code data as of Sept. 1, 2026. Dates are reported by quarter in the top 10 and by year in the full table. The top 10 includes U.S. area codes only and counts overlay complexes that NANPA reports together as one entry; some area codes, such as 917, appear in two entries because NANPA lists them in two complexes. Area codes NANPA projects to last more than 100 years are shown as “2126 or later.” The 239 and 375 counts refer to geographic area codes serving the U.S. and its territories.
Sources:
- NANPA October 2026 NPA Exhaust Analysis
- NANPA Changes from April 2026 NPA Exhaust Projections (July 6, 2026)
- NANPA NPA Relief Planning
- NANPA Area Code Relief FAQ
- NANPA Planning Letter 630 — New York 465 Overlay
- NANPA 2000 Annual Report
- NANPA 2025 Annual Report
- California Public Utilities Commission Presentation on Area Code Relief
- NANPA February 2026 Revisions to October 2025 Projections
- October 2026 NANP Exhaust Analysis (Full Numbering Plan)